
The yield curve is a graphic representation of interest rates for similar-quality bonds at different maturities and is as such viewed as a reflection of expectations of future interest rates. The yield curve also enables investors to compare the yields offered by bonds of short-, medium- and long-term maturities when making investment decisions. So how does the shape of the yield curve at any point in time affect your investment portfolio?
Before we can answer this question, it is important to gain an understanding of the most common yield curve shapes and what they illustrate. The most common shapes that the yield curve can take are represented by a normal, an inverted and a humped yield curve. When short-term interest rates are lower than long-term interest rates, the yield curve takes a normal shape. If the opposite holds, i.e. short-term interest rates are higher than long-term interest rates, the yield curve is said to be inverted. Finally, when a yield curve is humped, medium-term interest rates are higher than short-term and long-term interest rates. The graphs of the current yield curves for U.S. and Canadian government bonds below serve as illustrations of the shape yield curve (do the curves appear to be normal?)
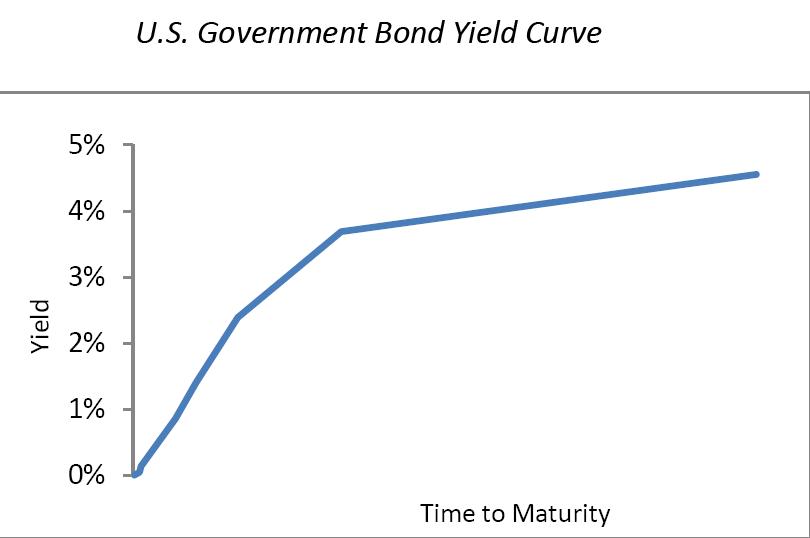
US Goverment Bond Yield Curve
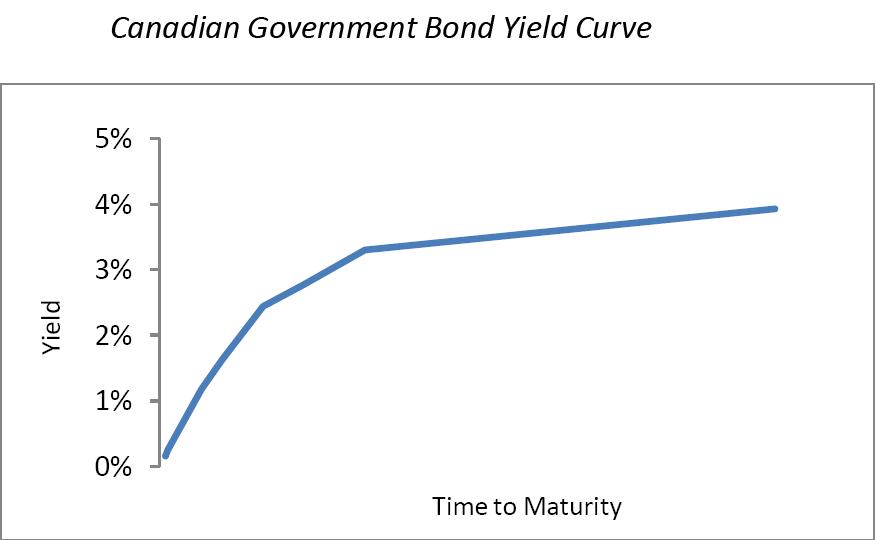
Canadian Goverment Bond Yield Curve
What does the shape of the curve tell investors?
Now that we have an understanding of the different shapes the yield curve can take, we can move on to explaining what they can mean. For example, when the yield curve is normal, investors expect interest rates in the future to be higher. The higher interest rates would be a result economic growth and higher inflation in the future. A normal yield curve also tells investors that long-term bonds yield a higher return than short-term bonds. Hence, investors with longer investment horizons might prefer to invest in long-term rather than short-term bonds. However, taking into account expectations of inflation as reflected in the shape of the yield curve, the higher return on a long-term security will in fact give an investor lower buying power as future cash flows are discounted at higher interest rates due to inflation. Moreover, the cash invested as principal will have a substantially lower purchasing power when it is returned in the future (say in 20 years), when interest rates are significantly higher. As a means of protecting against inflation, investors might consider altering their fixed income portfolio allocations and shifting some of their holdings into securities that are immune to inflation, such as TIPS. TIPS (Treasury Inflation Protected Securities) pay a principal at maturity that is adjusted for inflation and they also pay coupons as a percentage of the adjusted principal.
This article was written by Sabina C.
Sabina is a recent MBA graduate with extensive experience within the financial services industry and with additional experience in the real-estate development and investment industry. She has experience in performing research, valuation and risk profile analyses for fixed income portfolios
Sabina holds an MBA in Investment Management and Risk Management from the Ohio State University and a BA in Economics from Graceland University. She is a CFA Level 2 candidate.
{ 2 comments }